I came across a paper “Predicting Post-Dive Inert Gas Bubble Grades in Non-Decompression Scuba Diving with Air: Simplified Model for Enhanced Diver Safety” by Andreas Fichtner etal. They take another approach to the problem that in typical diving situations, DCS rates are so low that you would need a huge number of controlled dives to come to statistically significant conclusions about decompression models: They measure the appearance of venous gas bubbles instead directly looking for DCS symptoms.
Specifically, they recorded bubble grades after about 370 dives conducted by about 60 individual divers as well as other data about the dive (max depth, duration, total air consumption, diver’s age, surface interval, gender, time above 10m after reaching max depth) and then looked for a model that could predict the bubble grade from the other data. As a measure of success, they use Spearman’s rank correlation coefficient which tests if the model can accurately predict which of two dives lead to more bubbles, their main result being this plot of predictions vs. observed bubble grade.
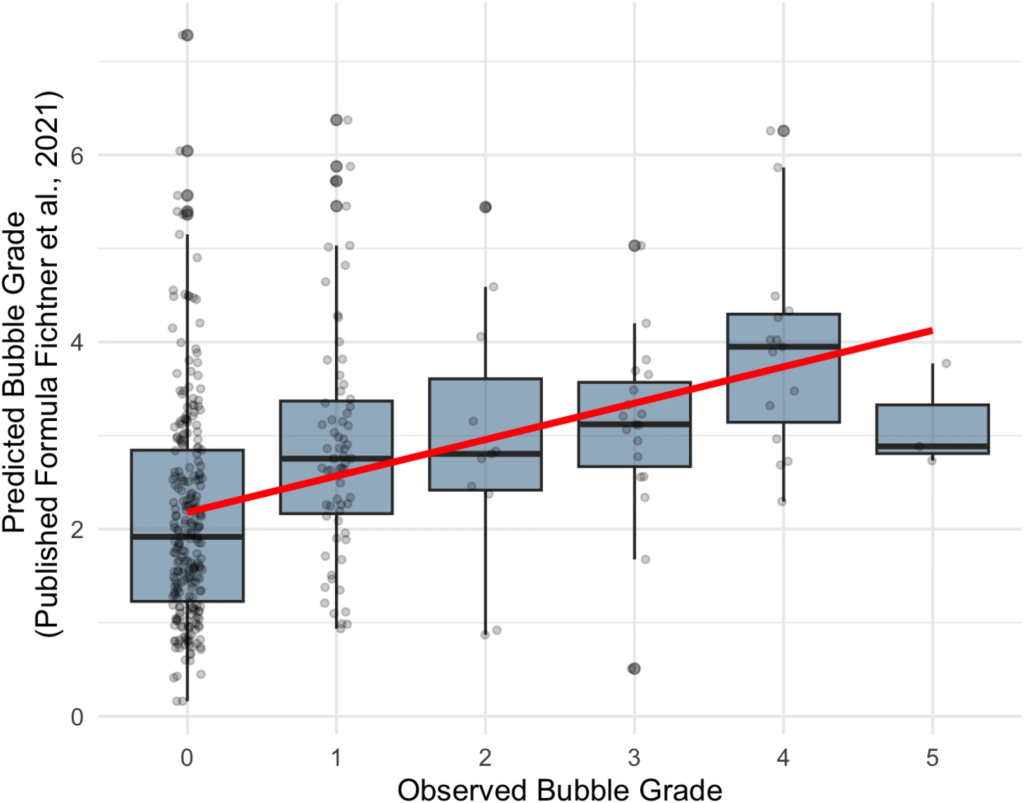
As you can see, this goes roughly in the right direction and they report rs = 0.39 for one of their models. There is also a machine learning model that had access to aspects of the profile date (see below) and that reaches rs = 0.47 .
There are a couple of points worth noting: First of all, the obvious, bubble grade is not DCS. You can have a high bubble grade without experiencing any DCS symptoms. However, as far as I know there are no DCS symptoms without any bubbles. Second, bubble grades are not very reproducible. They not only differ vastly between divers diving essentially the same profile, but even the same diver following the same profile on different days can have very different bubble outcomes. There is a long section on this in Dominik’s and Vero’s book. Finally, it’s not even clear that two measurements of the same diver after the same dive conducted by two different people will result in the same grade as there is quite some amount of subjectivity involved in interpreting ultra sound images. So it would be very surprising if there is any model that could reliably predict bubble grades as not even bubble grades are such good predictors of bubble grades.
What makes me wonder is how people can think that you can expect to predict decompression outcomes (in the widest sense) by just looking at data like max depth and total dive time. I can think of many possible profiles that all have the total dive time and maximum depth in common but differ vastly also in terms of how risky I would expect them to be. Think for example 60 min total time with max depth 40 m. That could be a quick dip and then a long time in shallow waters or a dive with significant deco obligation. Taking into account the total gas consumption as well gives some further information but depends on average depth, physical exhaustion and body mass in an almost impossible to disentangle way (all of which individually could be expected to influence deco quality).
If there is one thing that we learned from decades of quite successful decompression modelling is that details of the profile matter. But what we usually summarise those in are the tissue loadings. So what I would try to do is to find correlations between tissue loadings and bubble grade rather than the other parameters (which I would think of as of secondary relevance).
Luckily, the paper is not only Open Access (so you can all read it without charge even when you don’t have access to your local university’s journal subscriptions) but also Open Data! So you can download their data set (I wish you could say the same about the DAN database) of all the 370 dives with all their meta data.
So that’s what I did. It contains the profiles only as depths in five minute intervals which is quite coarse compared to what the typical dive computer records but better than nothing. I converted those profiles into a Subsurface dive log and let Subsurface run it through the Bühlmann model. Exporting that in the “profile data” format yields a huge CSV file that contains the “percentages” for each tissue at every point of the dive. These percentages are used by subsurface to produce the heat maps as well as the Shearwater like display of dynamical tissue loadings in the info box in the profile.
The percentages are defined to be 50% times the tissue inert gas pressure divided by the total ambient pressure (i.e. 50% percentage means tissue pressure equals ambient pressure and smaller numbers mean that the tissue pressure is only a fraction) while values above 50% mean 50% plus the momentary gradient factor for that tissue. This is a bit non-linear because of the jump between comparing the tissue pressure with the ambient pressure (for below 50%) and the M-value (above 50%).
\( p= \left\{
\begin{array}{ll} 50\%\cdot p_{tissue} / p_{amb} & p_{tissue} < p_{amb} \\ 50\% + GF/2 = 50\% + \frac{p_{tissue}-p_{amb}}{M-p_{amb} }50\%& p_{tissue}\ge p_{amb} \\ \end{array} \right. \)
But pretty much all the tissue pressures I looked at were above ambient pressure so it does not really have much on an effect.
Specifically, I looked at the percentages at the end of the dive for the faster 8 tissues of the Bühlman model (I picked those as the slower ones with half-times above 77 min were not really excited by these dives which all did not last much longer than an hour). I also tried taking all 16 into account but the effect was minimal.
So, with these 9 percentages for each dive I did the simplest thing you can imagine: I tried to fit the bubble grade with a multi-linear regression (I did this in Mathematica, here is the notebook). Here is the predicted vs. the measured bubble grade.

It looks pretty similar to the other plot and in fact yields a Spearman correlation of rs = 0.41 so is of the same quality as the prediction in the paper that takes all the other factors also into consideration. I also tried to use the highest percentage per tissue during the dive rather than the value at the end of the dive and the result was quite similar. Taking all 16 tissues into account yields a slightly stronger correlation but at the expense of twice as many variables.
What is also quite interesting is the weight of each tissue in the multilinear fit, here plotted as a function of the tissue number:
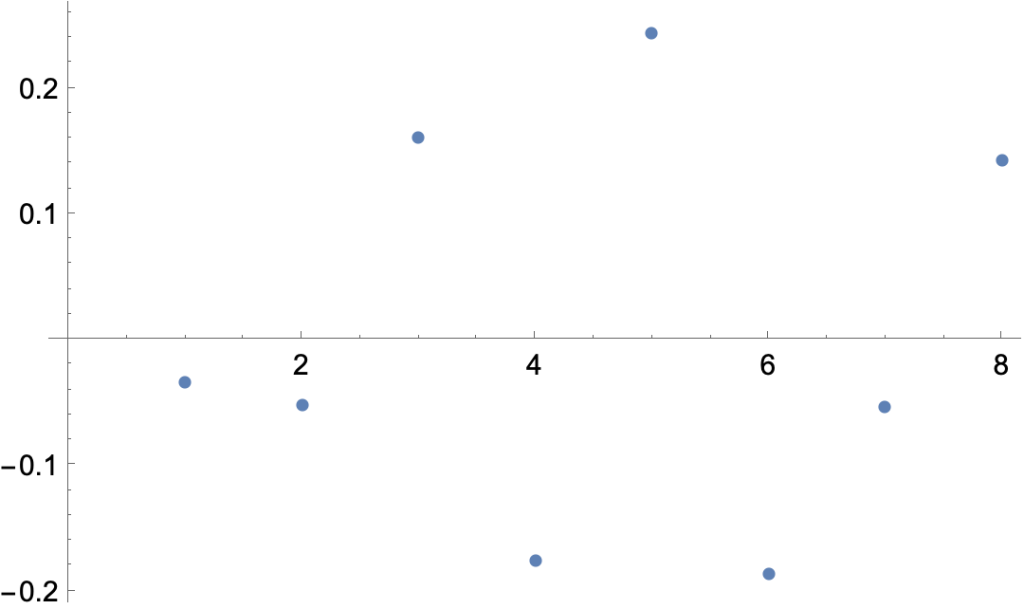
You can see, everything happens between tissues 3 to 6. These correspond to half-times of 12.5 to 38 minutes, not too surprising for dives that all take roughly an hour. The strongest influence has tissue 5 (27 min) and somewhat surprisingly, the neighbouring tissues have a negative weight. Honestly, I do not really know what to make of that. It might be an oddity of the data.
In any case, it would be interesting to redo the study for a set of dives with larger variety, that is with more different dive times (significantly longer and shorter), not restricting to non-decompression NDL dives, having dives at greater depths and other breathing gases than air etc etc. Those would be even more relevant to look at deco quality rather than these typical recreational dives most of which are quite risk less in the first place.
Besides those introducing more variables to take into account there would probably also be practical difficulties in recruiting divers that do a significant number of those dives at a few different dive spots that you can visit with your ultra sound.
In the end, you can ask about the learnings of all this. In the paper’s conclusions the authors write “These results highlight the potential for real-time integration of individualised risk assessments into dive computers, thereby enabling divers to adjust personal behaviour both during the ascent and throughout the surface interval—ultimately aiming to lower the risk of decompression sickness even when standard computer-derived profiles are strictly followed.”. I don’t know. I would interpret my simple analysis as dive computers are already taking into account the most important factors of influence when computing tissue saturations. And beyond obvious statements that you should plan your dives more conservatively when you have risk factors like physical exhaustion or age or lack of fitness I do not see how to make more quantitative predictions or recommendations.