This is a contributed post by Doug Fraedrich in which he reports on a recent paper by him and which is also mentioned in Doolette’s blog post I just commented on.
Recently I published a methodology on how to set conservatism factors on commercial dive computers based on published probability of decompression sickness (DCS) data and statistical summaries/models thereof, (Reference 1.) That paper described the general methodology on how to adjust the conservatism of several different algorithms; this note will focus specifically on setting gradient factor levels for the Bühlmann ZHL-16C algorithm.
The basic methodology is to use the output of probabilistic models from the literature that were derived from many well-documented experimental man-trials of known dive profiles. Then pick a probability of DCS isopleth curve and use those to set gradient factors (or conservatism factors) such that the algorithm will output the No-stop time or total decompression time (TDT) specified by that isopleth. This was done for three metrics: no-stop times for short recreational dives profiles, total decompression time for longer/deeper decompression dives and “first stop depth” for decompression dives. There were no probabilistic models for first stop depths/decompression profiles, so for this metric, we used data from a NEDU controlled experiment, which compared PDCSoutcomes of dives of the same depth, bottom time and same TDT but with different stop profiles (Reference 2.) This NEDU study was performed specifically to assess the effect of deep versus shallow profiles as dictated by dual-phase vs tissue-loading algorithms.
So now to apply the methodology from that paper to the task of setting Gradient Factor levels for the Bühlmann ZHL-16C algorithm. From previous publications on the topic of gradient factors, we know that the value GF-Hi mainly affects total decompression time and GF-Lo affects the depth of the first stop. For GF-Hi, we will use the probabilistic model from a new study on No Stop Times by Howie et al. (Reference 3.) Using their criteria of 0.1 % serious DCS, we pick several point-pairs of depth and No-stop time and iteratively run theBühlmann ZHL-16C algorithm (specifically MultiDeco version 4.12)with different values of GF-Hi and match at what level the algorithm allows for a direct ascent at each individual depth-bottom time pair. The corresponding value of GF-Hi is 80.
As mentioned above, for GF-Lo, we use the US Navy NEDU study on deep stops, Reference 2. In the NEDU study, the maximum depth was 170 fsw, the bottom time was 30 minutes, the ascent rate was 30 fsw/min and the TDT for both profiles was 180 minutes. The group of divers who started their first stop at 40 fsw (for 9 minutes) had significantly lower PDCS(P= 0.0489 one-sided, Fisher Exact Test) than the group that stopped first at 70 fsw (for 12 minutes). Since there is not sufficient information to know exactly where between the two tested depths is optimal, this test case used the two depths as a maximum and minimum for the first stop criterion. For that dive profile, MultiDeco was iteratively run varying GF-Lo to see which levels of GF-Lo yield the two limiting first stop depths. This procedure indicates that GF-Lo should be higher than 55 (this was previously reported in Reference 1.) If you pick the mid-point of the two first stop depths between those profiles (assuming the optimal point is somewhere in the middle and not at either extreme) the resulted in GF-Lo being on the order of 70.
Of course, the above setting for GF-Hi was based on no-decompression dives which had a relatively low value of PrT of ~10-12 (Pressure Root Time is an indicator of the severity of the dive exposure where P = pressure in bar, T = dive time in minutes, Reference 4.)We know from Reference 4 that historically, the incidence of DCS is significantly higher for dives with a PrT > 25 and we know from Reference 1 that the required value of GF-Hi for ZHL-16C needs to decrease as the PrT of the dives increases. So to set GF-Hi for higher PrT decompression dives, we re-visited methods and models presented by Van Liew and Flynn, where they were specifically assessing the suitability of the US Navy’s decompression schedule (used at that time) by fitting data on single-level, non-repetitive, nitrogen-oxygen dives from the US Navy Decompression Database to a logistic regression that resulted in PDCSisopleths as a function of bottom time and TDT (Reference 5).We limited the domain of applicability of the current study to PRT< 40, so we used the “StandAir” Model which Van Liew andFlynn based ondata from standard air dives which had depths of less than 190 fsw and bottom times of less than 720 minutes. They assessed the StandAir statistical model to be reasonable except at the two depth extremes (nominally < 60 fsw and > 190 fsw). Van Liew and Flynn compared TDT required by the algorithm-under-test to the PDCSisopleths from their statistical model, and found that the TDT required by the algorithm-under-test lay between the 2% and 3% PDCSisopleths and thus deemed the algorithm acceptable for US Navy use. In the current study, we selected the 3% PDCSisopleth as an initial standard of comparison as a compromise between managing DCS risk while not requiring excessive total decompression times. Note that in their analysis, they combined data from all dives that had the same depth and bottom time, thus their PDCS results are averaging over many different (non-optimal) decompression profiles.
The process here is similar to what was described above using the No Stop Data, only with the Deco dives, it was a trio of data values of: depth-bottom time-TDT (at the 3% PDCS isopleth curve.) MultiDeco was iteratively run to match TDT for the input values of Depth and bottom time. The value of GF-Hi was noted and plotted against the PrT of the dive profiles used. These results are summarized in Figure 1.
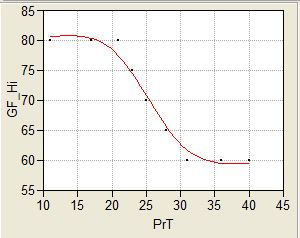
Note the curve in Figure 1 is of sigmoid shape: It is flat at both low and high levels of PrT with a transition in between. These results are based on dive profiles with observed DCS symptoms, and there are many more dives at the lower end of the PrT scale than the higher; so generally speaking the “error bars” start off small on the left side of the graph and get bigger as PrT increases. The point at which it levels out is considered somewhat uncertain.
To summarize:
- GF-Lo is recommended to be >= 55
- The recommended level of GF-Hi depends on the PrT of the dive, but is never greater than 80. It decreases with increasing PrT of the dive (to a point)
- While the uncertainty at the low end (say PrT < 25) is low, it increases with PrT (i..e. more research is needed in this part of the domain.)
References:
- Fraedrich DS, Validation of algorithms used in commercial off-the-shelf dive computers, Diving and Hyperbaric Medicine, V48 No 4 , 2018
- Doolette DJ, Gerth WA, Gault KA. Redistribution of decompression stop time from shallow to deep stops increases incidence of decompression sickness in air decompression dives. NEDU TR 11-06, Panama City FL; 2011.
- Howie, LE, Weber PW, Hada E, Vann RD, Denoble PJ, The probability and severity of decompression sickness, PLoS ONE 12(3): e0172665,2017
- Balestra C. Dive computer use in recreational diving: Insights from the DAN-DSC database. In: Blogg SL, Lang MA, Møllerløken A, editors. Proceedings of validation of dive computers workshop. 2011 Aug 24 Gdansk. Trondheim: Norwegian University of Science and Technology; 2012. p. 99–102.
- Van Liew HD, Flynn ET. A simple probabilistic model for standard air dives that is focused on total decompression time. Undersea Hyperb Med.2005;32:199–213.
Thank you for your interesting post.
Applying your suggested formula back onto the profiles from (ref2) Nedu TR11-06 multi-level thermal stress test, (170ft/30mins) has a PrT of 32, which by the suggested graph in Fig 1, gives a GF Hi of 62. A plan for 170ft/30min of GF 55/62, gives a TDT of 133 minutes (2.2 hrs).
Comparing that TDT to other existing planning tools for this profile examples: The USN’s dive manual published VVAL18M table has 88 mins TDT (rev 6), 96 mins TDT (rev 7). The DCIEM tables is 77 mins TDT. Also there is 2 decades of successful tech experience for this PrT level, with GF numbers like 25/85, and a TDT of 70 to 90 mins. All these tested / validated / experienced plans, give 35 to 70 mins (0.5 to 1.2 hrs) less deco time than your suggested GF settings – a significant difference.
From other papers mentioned above, published USN tables are normally 2% pDCS or less, and knowing that the real world experiences injury rate in tech diving is a tiny fraction of that, it would appear the GF Hi as suggested in Figure 1, is too restrictive. Those suggested PrT values and GF settings are producing plans that are way beyond the accepted experienced levels, or times from existing tested tables.
A closer look at the data basis used above from ref 2, reveals that the A2 profile already is a GF 61/77. An analysis of the test profile’s GF values is below (ref a, b, c). We can see from those GF plots, that the TR11-06 A2 profile is in-fact a test of a multilevel profile (+ 30 mins in 70/60 range, etc), and the implied assumption of a connection to tech diving or actual deep stops, is unproven and plainly non-existent. The reliance on data from TR11-06, does not seem to be useful for the purpose of creating GF planning recommendations.
ref:
a: GF of A1/A2. http://hhssoftware.com/images/nedu_a1a2vzhl.png
b: GF data A1/A2. http://hhssoftware.com/images/nedu_a1a2vzhl_data.png
c: profile compare: http://hhssoftware.com/images/170ft_30_air_NEDU.gif
May someone please post the exact formular how to calculate the PrT value? The references state “pressure” without saying if absolute or relative, nor do they exactly say if the root function has to be applied, and in case on which terms…
Thanks!
As far as I know, Doug is currently travelling. He will eventually come around to answer to comments.
Well, with some trying to reproduce the given numbers, the formular seems to be:
PrT = relative Pressure in bar x SQRT( bottom time in minutes )
Besides all the discussions on which GF low to take, i started to ask myself if the concept that the dive computer automatically sets the reference depth for the GF low really is what should happen. If the GF low/high ratio is meant to be used to control, i.e. reduce, the slope of the M line, then in order to produce repeatable behaviour, the GF low reference depth needs to be fixed – that is set along with the GF low value.
When the GF concept was published in imersed in 1998, dives were calculated “offine”, knowing the mission of the dive, hence planned bottom depth, time, and with having a rough idea on how the deco schedule will look like. With all these data known, the GF factors were then selected. Opposite to that, nowadays dives use computers that calculate their dives “online”, and on average they tend to stay with the GFs they have once set to the best of their knowledge or advice of somebody they trust in. In consequence, the concept of the M line and its modification through the GF low/high ratio is made kind of pointless because dependent on the particular dive and the resulting particular depth of the first stop, the GF low will grap the M line at arbitrary depths / pressures ranging between 3 and >> 30 meters. And even if a knowledged diver sets the GFs individually per dive according to planned bottom depth and time, these GFs will be sub-optimal in case of early abort as well as delayed ascent.
So to conclude: Changing the GF low depth logic from “where the first stop currently is” to a diver-defined GF low reference depth would be a rather small step for a dive computer programmer, but may it be a significant leap for the diver’s community?? Comments welcome!
Maybe you could justify the variable depth of applying GFlow by the fact that actually, it’s not about depth but about tissues. Given that pretty much universally, the first stops are dominated by fast tissues while shallower stops are determined by slower tissues, it could be that Bühlmann was too optimistic for the fast tissues’ M-values and those are corrected by smaller GFlow.
Hm…. I just reread Erik Bakers article “Clearing up the confusion about deep stops” for any hints on where to put the GF low reference depth. He doesn’t say it explicitly, but between the lines it sounds to me that he is putting the GF low depth to the depth were the first tissue comes into supersaturation, i.e. tissue pressure becomes equal to ambient pressure. He names this depth “the begin of the decompression zone” and also the “deepest possible stop”. Further on, he writes: “The lower gradient factor value determines the depth of the first stop. Used to generate deep stops to the depth of the deepest possible deco stop.” Hence, with a GF low of 0%, the first stop shall be placed at the begin of the decompression zone aka GF low reference depth, and with GF lows >0% the stop will slide upwards until hitting the classical stop depth determined by the M-line at 100% by means of modifying the original M-lines by his GF-formulars.
Interestingy, he also wrote: “when reaching this point (the deepest possible stop) during ascent from the bottom, the diver should slow down the ascent to the decompression zone rate of 10 msw per minute or less”. In other words: he assumes the first part of the ascent will be done much faster. When i remember Bühlmann right, he claims 10 meters/minute to be the maximum speed for all ascent in his model. While ascending, the tissues do offgas, the faster one more than the slower ones, and there is good reason to assume that Bühlmann has factored in this en route offgassing into the respective a and b coefficients. Thus, in case the initial ascent is done much faster, the fastest tissues will be brought bejond the limit of the Bühlmann model, and the only cure for this is to subsequently reduce their M-value, by introducing deep stops, calculated with GF factors…
Short, none exhaustive experiment using my dive computer’s simulation mode: GF off, 21/35 gas, bottom depth 50 meters, bottom time 30 minutes, all ascent with 10m/min. Result: the first stop will be at 15 meters, with leading tissue being tissue number 4 ! The tissues 1 -3 loose so much pressure during the ascent that they are not the controlling ones during any part of the ascent… But they will be in control in case of faster ascent, and then stopping wouldn’d be required at 15 meters but deeper — deep stops will be required then. So, to put it a bit into provocative words:
Are deep stops and GFs (at least partwise) the aswer to overspeed initial ascents?
Update: with same dive on air, it is on the edge of tissue 2 to 3 being in control, so obeying the Bühlmann speed limit is even more important.
Looking at figure 3 of Baker’s paper it seems to be pretty explicit that GFlow is supposed to apply at the first stop, not at the “start of the decompression zone”.
For sure the GF low depth aka 1st stop depth will slide with the GF low factor value. For a GF low of 0% the GF low depth will be at the start of the decompression zone, hence it can be called the “reference depth”. Practical first stop depths will then be between this GF ref. depth (for a GF low = 0%) and somewhere further up (for GF low > 0%). But that wasn’t supposed to be the main point of my post, it was on initial ascent speed and its relation to requiring deep(er) stops.