
Here is a second guest post by Doug Fraedrich on how to select gradient factors:
For this next phase of the analysis, we will probe the GF-Hi vs PrT issue with other suitable data sources other than the Van Liew and Flynn model and look into the GF-Lo question without direct reliance on the 2011 NEDU Deep Stop experiment.
There are several suggested methodologies in the literature for the validation of models in general (Reference 1) and dive computers in particular (Reference 2.) The method I used above is similar to one suggested in Reference 2, of comparing the results of a commercial dive computer to one of the US Navy probabilistic models (which are essentially least-squares fit to many DCS observations); in this case the Van Liew and Flynn “StandAir” model was used. Another possible approach suggested in Reference 2 is to compare the unit under test directly to well-validated Navy dive tables, i.e. VVAL-79 (Note that VVAL-79 is an updated version of VVAL-18, which was necessitated by an unacceptably high incidence of DCS using VVAL-18.) Denoble suggests a similar but more general approach of comparison to so-called “primary models” which include VVAL-79 and also the Canadian DCIEM tables (Reference 3). Denoble defines “Primary Models” as those that have been extensively and methodically tested with man-trial data. For the remainder of this article, we will limit our analysis to using Primary Models. The validation of commercial dive computer algorithms is in its infancy, so it is instructive to use different sound methodologies and different “gold standards” to get a sense of the uncertainty in results. As a community, we can make it our goal to continually refine our methods and use new data as it becomes available to reduce this uncertainty over time.
In this new cross-validation study, the ZHL-16C model was iteratively run with different values of GF-Lo and GF-Hi to match the results VVAL-79 and DCIEM Tables.
The results are shown in the Figure 1 below.
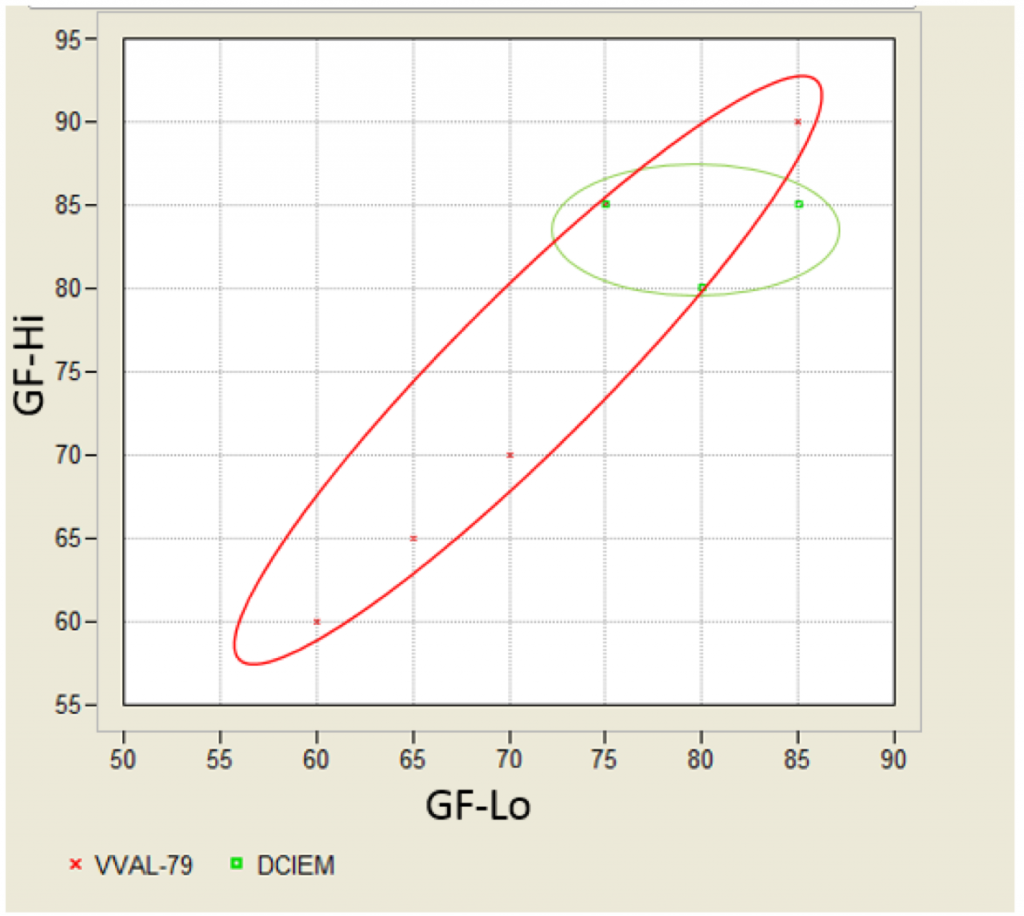
The diagonal nature of the VVAL-79 results reflects that both GF-Lo and GF-Hi are indicated to decrease with increasing PrT; this not surprising since the Van Liew and Flynn data mentioned above also was used in the Navy’s model development and validation process. Note that the results for the DCIEM tables do not exhibit this behavior.
In order to add more information to this analysis, we will consider a third model, SAUL, which is an update of the original Kidd-Stubbs DCIEM serial model and would certainly meet the Denoble criteria of a “Primary Model.” It has been tested by three datasets of man-dives with P-DCS statistics: a core dataset of 733 dives (Reference 4) and two secondary datasets, DSAT (1437 man-dives) and the NEDU 2011 Deep-stop dataset (390 man-dives.) A full dive-planner is not openly available for this model, but an online version is available that handles no-decompression dives, and estimates P-DCS of a specified dive profile assuming a 3 minute safety stop.
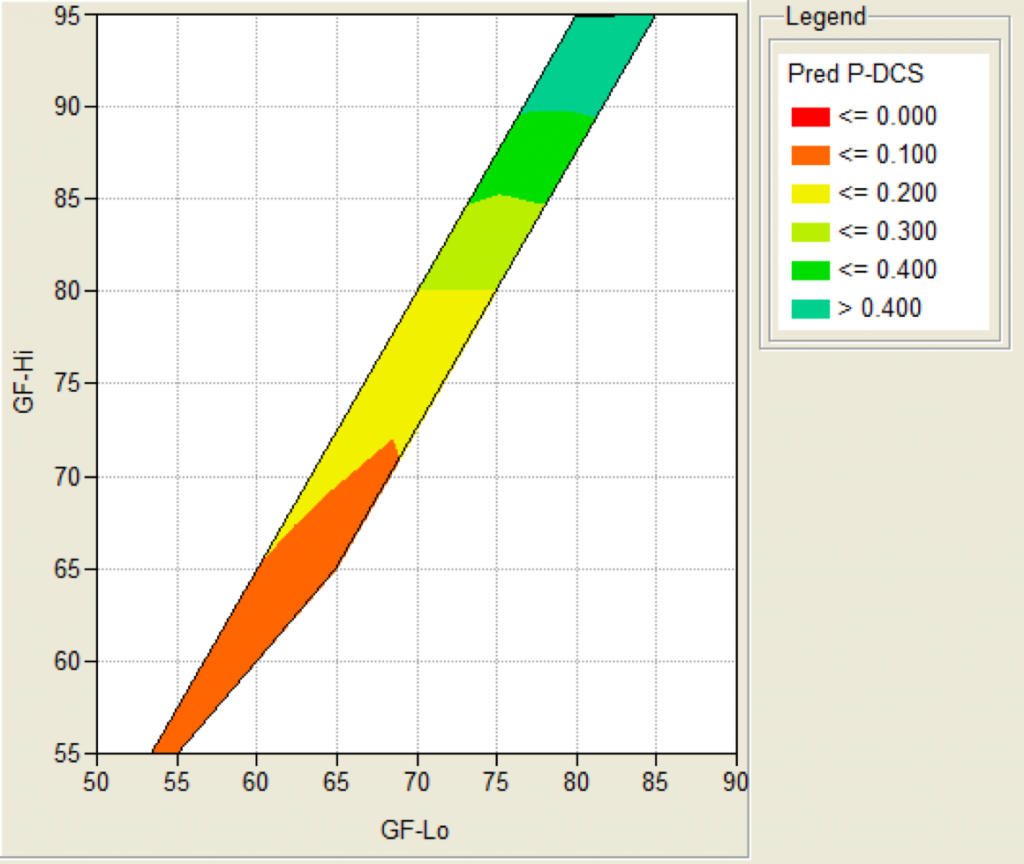
For selected combinations of GF-Lo and GF-Hi, the ZHL-16C model is run iteratively with varying values of depth and bottom time to yield a 3 minute shallow stop. The SAUL dive planner is then run with those depth and bottom time values and the estimated P-DCS is computed. This P-DCS is plotted as a function of GF-Lo and GF-Hi, Figure 2. Unfortunately, for a given value of GF-Hi, only a narrow range of GF-Lo meet the criteria of mandating a 3 minute shallow stop (clearly illustrated in Figure below.) So these new results do NOT inform the GF-Lo debate nor the GF-Hi vs PrT issue. It does quantify P-DCS for a diagonal swath of GF values; which is a good start. So if your risk tolerance is say 0.25%, you would want to set GF-Hi between 80 and 85.
It is worth noting that these three primary models are not only well-tested with man-trial data, they are based on differentdatasets. So any conclusion based on areas of common agreement amongst these models can be considered as having a fairly low uncertainty.
To try to summarize where I think we are based on these data sources using the 3 primary models VVAL-79 DCIEM and SAUL, and supplementing with references to the data-based statistical models from both Howie et al and Van Liew and Flynn (both based on large datasets of man-trial DCS data), see the results below, which are partitioned into a 2×2 matrix:
| Low PrT Dives/Non-Deco Dives | High PrT Dives/Deco Dives | |
| GF-Hi | All 5 sources agree on a range of 80-90 | VVAL-79 and Van Liew and Flynn indicate 60-70; DCIEM shows 80-85. SAUL and Howie are silent |
| GF-Lo | VVAL-79 and DCIEM agree on a range of 75-85, while the other 3 sources are “silent” or non-informative | VVAL-79 indicate 60-70; DCIEM shows 75-85. SAUL, Howie and Van Liew and Flynn are silent |
For Low PrT dives, I would consider the recommendations for GF-Hi to be fairly conclusive. A little less so for GF-Lo, but there is an extensive man-dive database for these types of dives to back it up. For High PrT dives, we see the two main Primary models, VVAL-79 and DCIEM result in recommended ranges that do not overlap; so this is an area of future focus. Recommendations for GF-Lo for High PrT dives are the most uncertain. Several potential ways-ahead come mind. The full SAUL model could be executed to estimate P-DCS of dive profiles computed by ZHL-16C over the entire range of gradient factors. Or potentially, the DAN Project Dive Exploration observational database (Reference 5) could be mined to focus at high PrT dives, and convert reported dive profiles to equivalent ZHL-16C results with whatever GF’s are needed to match the profiles. The issue here may be to adequately address potential underreporting of dives where no DCS was present, and thus attempting to ensure the resultant P-DCS statistics are unbiased. Clearly more work is needed here.
References:
- Fraedrich D and Goldberg A “A methodological framework for the validation of predictive simulations” European Journal of Operational Research, 124(1):55-62 · July 2000
- Doolette DJ, Gault KA, Gerth WA, Murphy FG. US Navy Dive Computer Validation. In: Blogg SL, Lang MA, Møllerløken A, editors Proceedings of Validation of Dive Computers Workshop 2011 Aug 24 Gdansk. Trondheim: Norwegian University of Science and Technology; 2012. p. 51–62.
- Denoble PJ. Conservative diving: calculating and mitigating the risk of DCS. Alert Diver 2013; 29(3): 46-9.
- Goldman S, A new class of biophysical models for predicting the probability of decompression sickness in SCUBA diving. Journal of Applied Physiology, 2007. On-line dive planner at: http://moderndecompression.com/?page_id=493
Since I can’t read German: does Tauchmedizin have the DCS probabilities for its parameter sets? If so, I wonder how one would compare them to those given by SAUL’s >.4