
I have talked previously about oxygen toxicity, in particular about the influence on the pulmonary system measured in OTUs. But there is a second effect, the one on the brain (CNS). This effect is strongly dependent on the partial pressure of oxygen in the breathing gas and is conventionally expressed in terms of the “oxygen clock” or as %CNS.
At each pO2, there is a maximally allowed exposure time \(t(pO_2)\) and at each depth one can spend a certain percentage of that time, the percentages being added up over a dive.
Which leaves us with the question of how to obtain \(t(pO_2)\). It seems, everybody is using essentially the same table of values published by NOAA, with the time being infinite for pO2 < 0.5 bar, then starting with 720 minutes and then steeply decreasing to 45 minted at a pO2 of 1.6 bar where the table ends as you are not supposed to breath a pO2 above that value.
As it turns out, the empirical basis for this table is hard to find, as it, in the words of Bill Hamilton, it “is not based on a specific set of experiments but rather on the accumulated wisdom of experts in this field.”
So far, in Subsurface, we have used the same table and have used linear interpolation for values of pO2 in between. At high enough partial pressures, the maximal exposure time get shorter quickly, so with linear extrapolation beyond 1.6 bar, they quickly become negative. As the CNS% is given by the time spent at that particular pO2 normalised by the maximal time, this leads to the clearly absurd result of negative CNS% values. We had to do something about this.
This first step is to plot the table values (note that in the internals of Subsurface, all times are expressed in seconds while all pressures are in mbar):
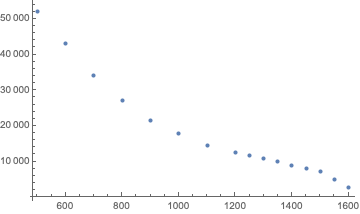
Hmm, nothing obvious. So, let’s use a log scale for the times:
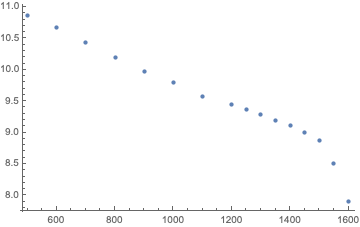
Ah, except for the last two points, this looks pretty much like a straight line. Too bad, the last two points at the highest pressures are the most important ones, so we should better not just forget about them.
There was some discussion, how to deal with these points, a fourth order polynomial fit (green) was discussed as well as using two straight lines, one for everything below 1.5bar and another one for the last three points (orange):
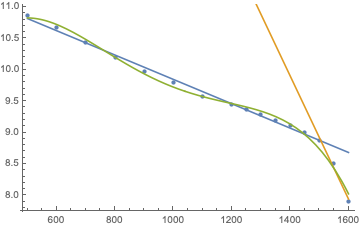
Turns out, the sum of squared deviations for the green fit is 0.06452 while the two lines give 0.0314796, i.e. the latter are twice as good, so let’s use those.
As these lines are fits for \(\log(t(pO_2)\), the resulting formula is
\(t(pO_2) = t_0 e^{-pO_2/p_c}\)with t0 = 131300 s = 2188 min and pc = 516mbar for pO2 in between 0.5 bar and 1.5 bar and \(t_0 = 1.83861\cdot 10^{10} s= 3.06436\cdot 10^8 min\) as well as pc = 102 mbar above.
There is a mathematica notebook with these calculations in case you want to play with the numbers yourself.
There is a theoretical basis
It’s based on the work of Kenneth W Donald, RNPL, 1939-1943.
He did all the initial hyperbaric oxygen toxicity studies that were subsequently published in two magnificent papers that mark the invention of Nitrox as a diving gas
Donald, K. W. (17 May 1947). “Oxygen Poisoning in Man. Part I”. Br Med J. 1 (4506): 667–672. doi:10.1136/bmj.1.4506.667. PMC 2053251. PMID 20248086.
Donald, K. W. (24 May 1947). “Oxygen Poisoning in Man. Part II”. Br Med J. 1 (4507): 712–717. doi:10.1136/bmj.1.4507.712. PMC 2053400. PMID 20248096.
Yes these were historically very important investigations into the subject. But I would deceive them as empirical (he describes the outcomes of his experiments) rather than theoretical as he, as far as I can see makes no attempt to model his findings.