
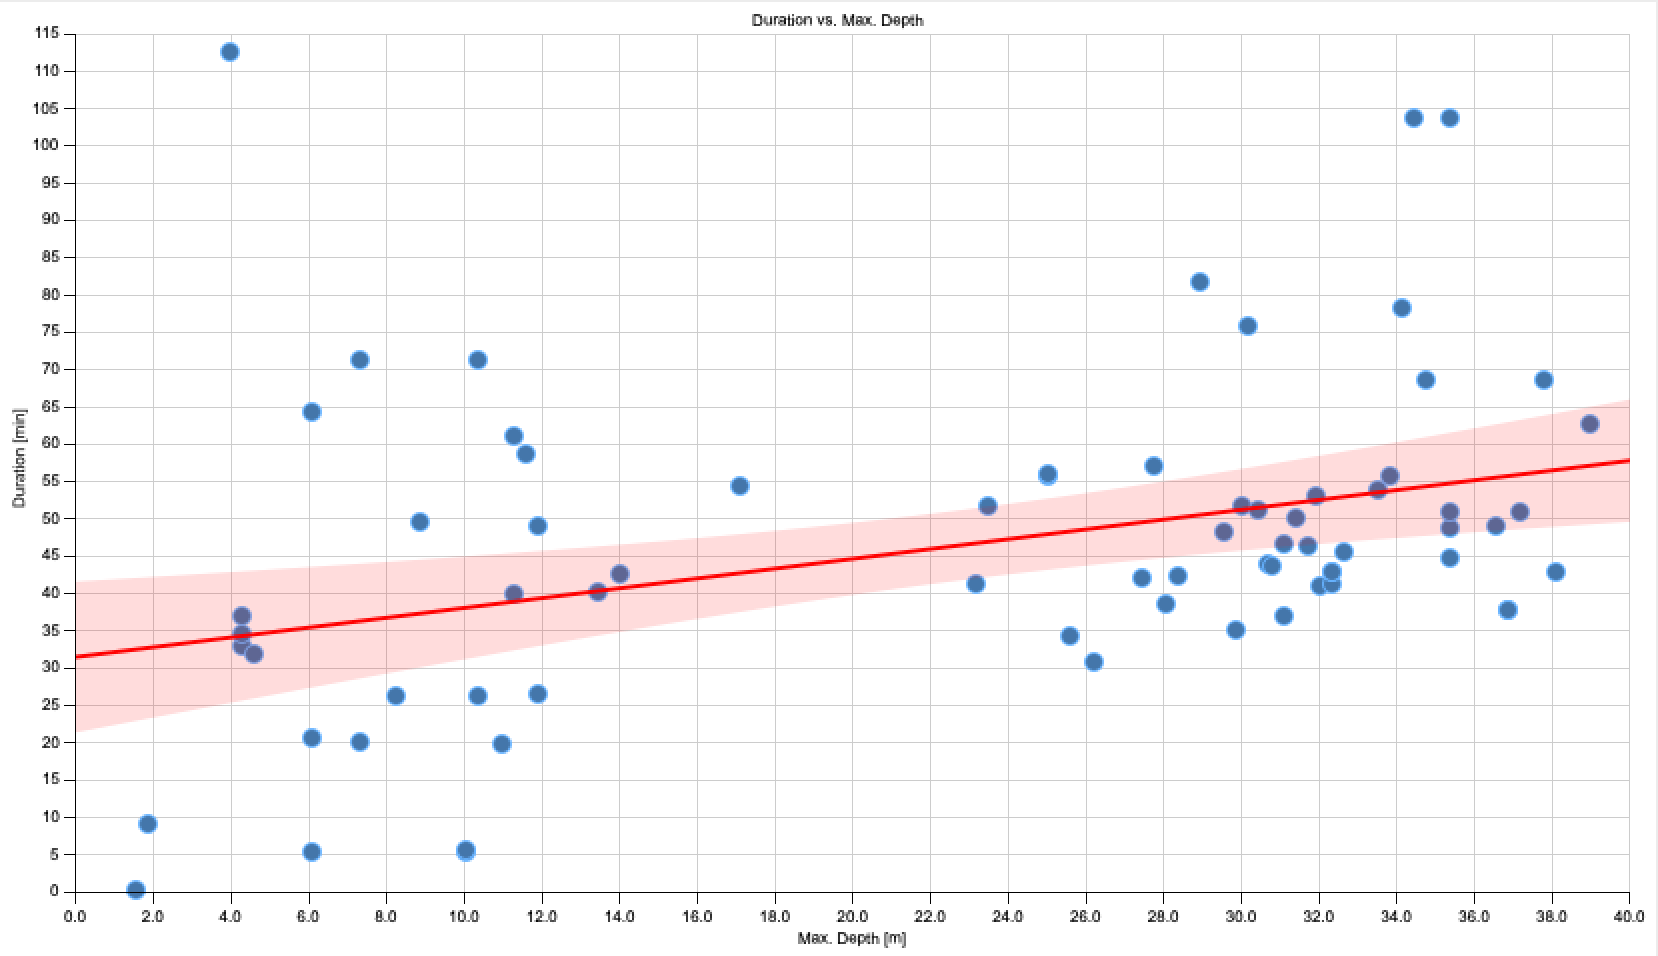
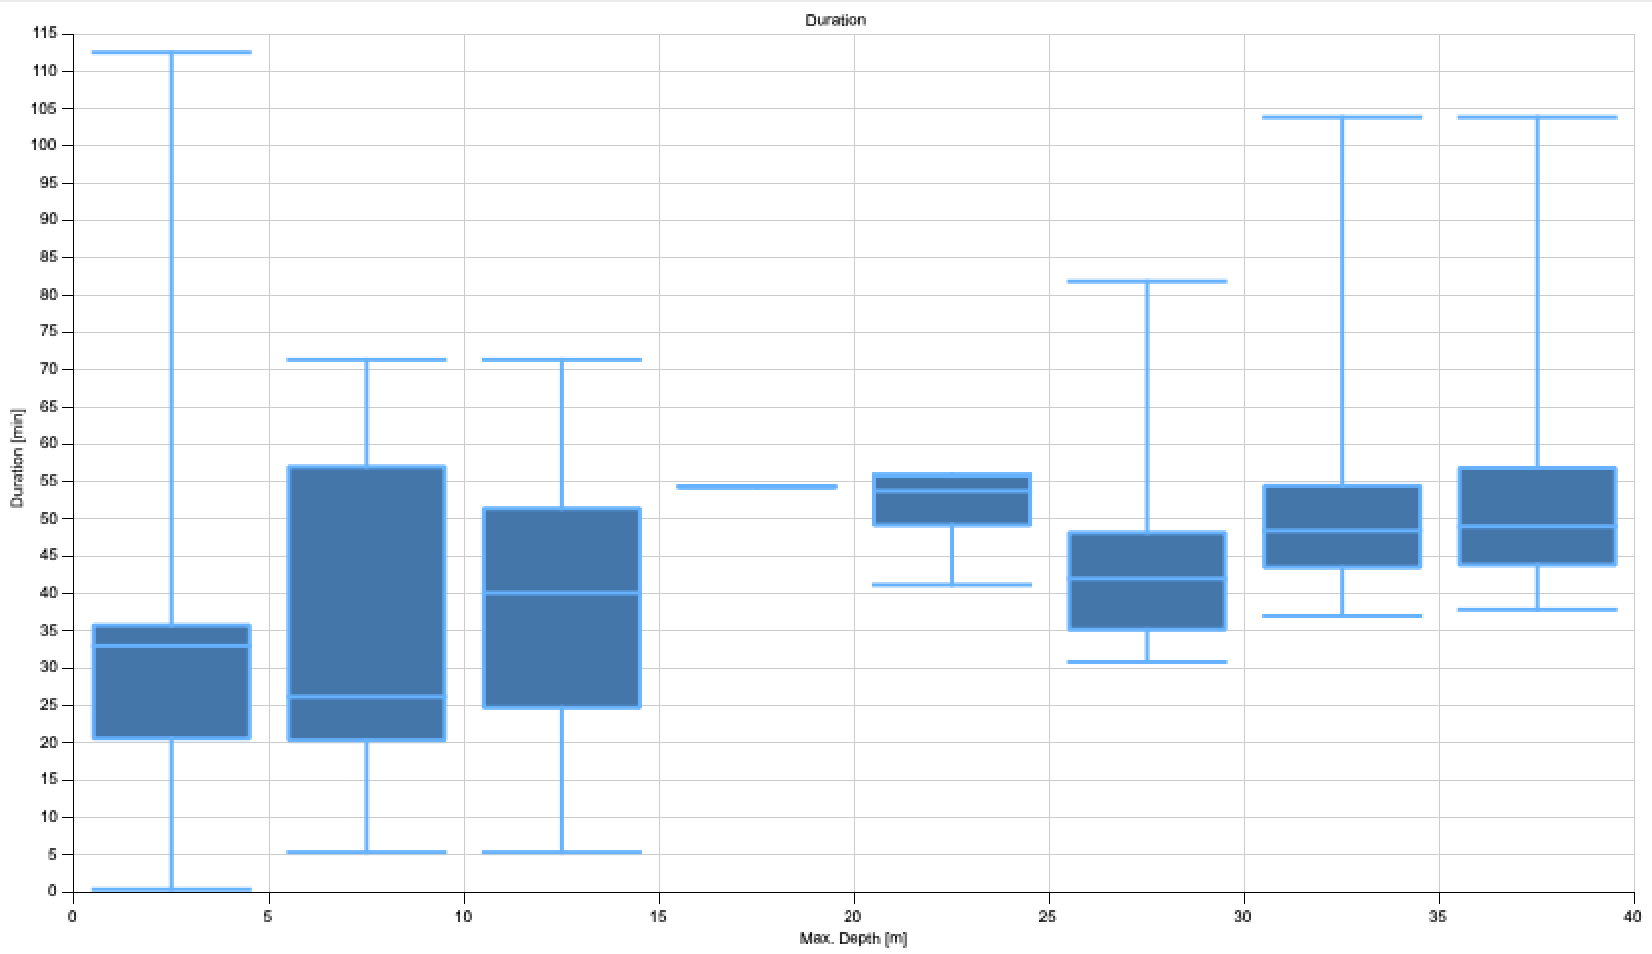
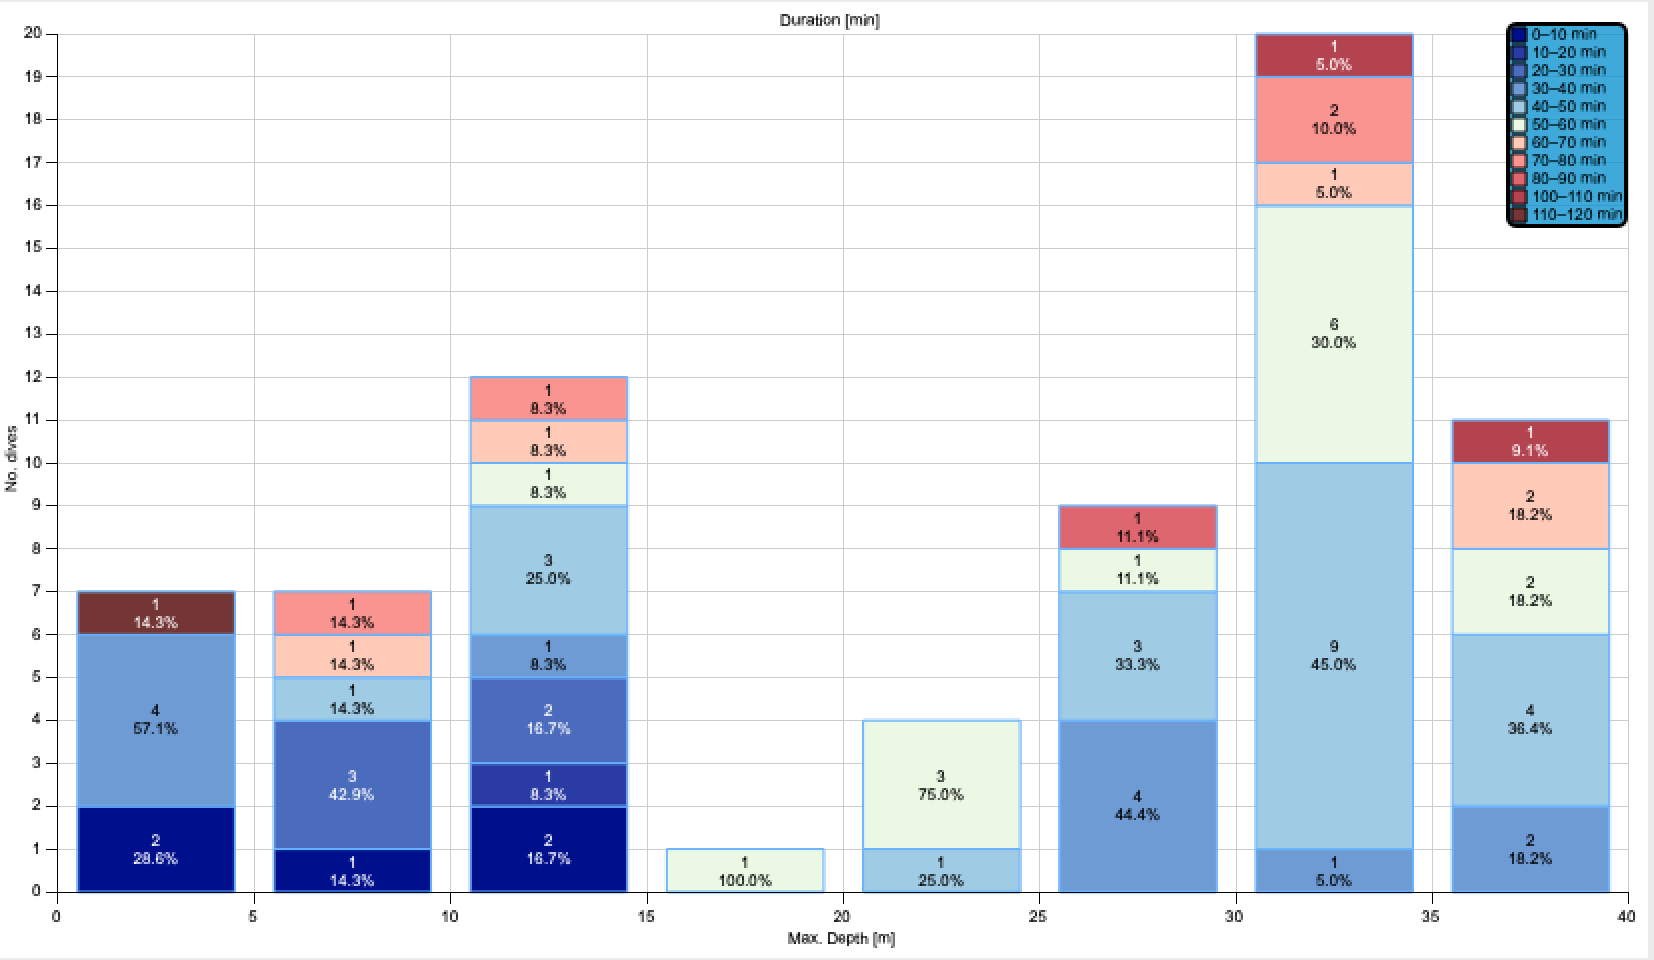
You wouldn’t be here if you didn’t enjoy quantitative analysis of anything diving. There is a special treat for you: Thanks mainly to Willem and Berthold of the Subsurface development team, you can now use Subsurface to do all kinds of statistics on you dive log. There are many cool graphical representations of looking at essentially any variable from your log (depth, duration, date, SAC, rating, visibility, gas use, oxygen or helium percentage, location, buddy etc etc) as functions of each other:
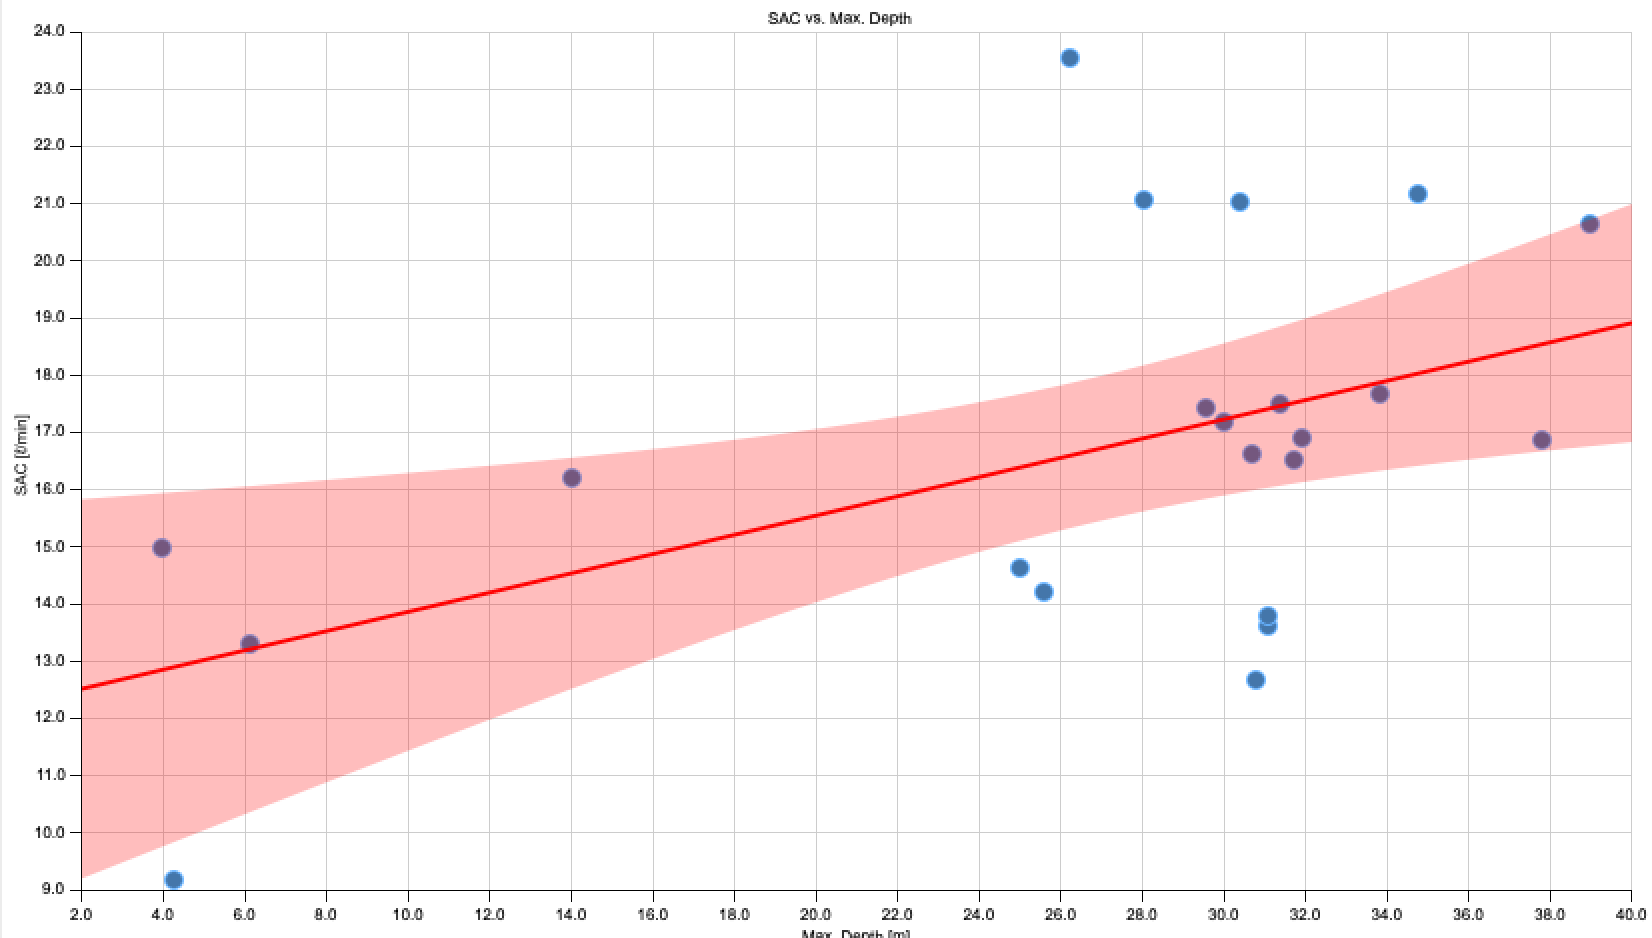
Go ahead and see how your SAC changes over time or which buddy you do the longest dives with or if you use less gas on dives with better visibility.
This is still an an alpha testing phase and crashes are still possible and things will change before the next upcoming release. But you can download a test version from our daily builds. There are also mobile version available from Testflight for iOS and the Google PlaysStore beta program. Please comment on the Subsurface mailing list or on Github if you find bugs or have ideas for improvement.