Calculating Oxygen CNS toxicity

I have talked previously about oxygen toxicity, in particular about the influence on the pulmonary system measured in OTUs. But there is a second effect, the one on the brain (CNS). This effect is strongly dependent on the partial pressure of oxygen in the breathing gas and is conventionally expressed in terms of the “oxygen clock” or as %CNS.

At each pO2, there is a maximally allowed exposure time \(t(pO_2)\) and at each depth one can spend a certain percentage of that time, the percentages being added up over a dive.

Which leaves us with the question of how to obtain \(t(pO_2)\). It seems, everybody is using essentially the same table of values published by NOAA, with the time being infinite for pO2 < 0.5 bar, then starting with 720 minutes and then steeply decreasing to 45 minted at a pO2 of 1.6 bar where the table ends as you are not supposed to breath a pO2 above that value.

As it turns out, the empirical basis for this table is hard to find, as it, in the words of Bill Hamilton, it “is not based on a specific set of experiments but rather on the accumulated wisdom of experts in this field.”

So far, in Subsurface, we have used the same table and have used linear interpolation for values of pO2 in between. At high enough partial pressures, the maximal exposure time get shorter quickly, so with linear extrapolation beyond 1.6 bar, they quickly become negative. As the CNS% is given by the time spent at that particular pO2 normalised by the maximal time, this leads to the clearly absurd result of negative CNS% values. We had to do something about this.

This first step is to plot the table values (note that in the internals of Subsurface, all times are expressed in seconds while all pressures are in mbar):

Hmm, nothing obvious. So, let’s use a log scale for the times:

Ah, except for the last two points, this looks pretty much like a straight line. Too bad, the last two points at the highest pressures are the most important ones, so we should better not just forget about them.

There was some discussion, how to deal with these points, a fourth order polynomial fit (green) was discussed as well as using two straight lines, one for everything below 1.5bar and another one for the last three points (orange):

Turns out, the sum of squared deviations for the green fit is 0.06452 while the two lines give 0.0314796, i.e. the latter are twice as good, so let’s use those.

As these lines are fits for \(\log(t(pO_2)\), the resulting formula is

\(t(pO_2) = t_0 e^{-pO_2/p_c}\)

with t0 = 131300 s = 2188 min and pc = 516mbar for pO2 in between 0.5 bar and 1.5 bar and \(t_0 = 1.83861\cdot 10^{10} s= 3.06436\cdot 10^8 min\) as well as pc = 102 mbar above.

There is a mathematica notebook with these calculations in case you want to play with the numbers yourself.

A few thoughts on Oxygen Toxicity

Recently, at Subsurface, we decided to look into the calculations of oxygen toxicity related to diving. Here is what I learned (admittedly, not too much). According to what we could find on the inter-webs, there are two things to consider: The effect on your brain (the CNS value) and on you lungs (OTU for oxygen toxicity unit). The former seems to be simply a table look-up, so there is not much to do about it. The best we could do (thanks Willem) was to do a linear interpolation of table values.

For OTU, there is some thing to calculate. The empirical basis seems to be a measurement of the reduction of effective lung capacity after breathing O2 at higher partial pressure for an extended period of time. As far as we could tell, the current theory goes back the the thesis of Clark and his supervisor Lambertsen.

They found that there is no effect as long as the partial pressure of O2 stays below 0.5bar and any effect is proportional to the excess of partial pressure over 0.5bar and, according to their fit, it is also proportional to the exposure time to the power 6/5, i.e.

\((p-0.5bar) t^{6/5}\)

The power slightly bigger than 1 sounds somewhat believable since a lung that already suffers could be more susceptible to further damage. This value was obtained by plotting their data on a log-log-scale, fitting a straight line and reading off the slope of that straight line as the exponent thanks to

\(\log((p-0.5bar) t^{6/5}) = \log(p-0.5bar) + \frac 65 \log(t).\)

You can see this in their figure 18A on page 164. There you will also spot that the linear regression is not really good. This was also pointed out later in a more comprehensive study of the Naval Medical Research Institute that found that later data but also the original data of Clark and Lambertsen was more compatible with an exponent of 1. But the 6/5 stuck in the literature and all that follows below is non-trivial only because the power is different from 1.

What people then did was to take the 5/6-th root of this expression as the definition of the oxygen toxicity unit (normalised to a partial pressure of 1bar), i.e.

\(OTU = \left(\frac{p-0.5bar}{0.5bar}\right)^{5/6}t.\)

For time varying O2 partial pressure this could then be integrated over time, as for example proposed by Erik Baker (yes, the Erik Baker of VPM-B). Again, he publishes an implementation in his favourite programming language, FORTRAN. Well except, that he uses the reciprocal of that fraction and raises it to the power -5/6, with the additional benefit of risking a division by zero at the boundary case of partial pressure 0.5bar.

And of course, integrating this 5/6-th root makes no sense: You still get something linear in time whereas originally it was found that the damage progresses faster than time!

As you are integrating, you can also write a closed formula for a time segment where the partial pressure changes linearly in time (like during an open circuit dive during an ascent or descent). You need to compute

\(\frac 1{p_b-p_a}\int_{p_a}^{p_b} ((p-0.5bar)/0.5bar)^{5/6}dp = \frac 3{11(p_b-p_a)} \left.\left(\frac{p-0.5bar}{0.5bar}\right)^{11/6}\right|_{p_a}^{p_b}\)

This is Baker’s equation 2. Computationally, this formula has the disadvantage that a constant partial pressure is no longer a special case for this formula as one encounters a 0/0 floating point exception. Of course, taking a proper limit yields the above equation for the OTU but this is not convenient in a computer program.

So, what we did was to introduce better variables \(p_m=(p_a+p_b)/2\) and \(\delta = (p_b-p_a)/p_m\) in the integral expression above and then expand in powers of \(\delta\). By symmetry, only even powers appear and so a two term quadratic expression if good up to \(O(\delta^4)\), by far good enough for our purposes. This yields the improved expression

\(OTU =  \left(\frac{p_m-0.5bar}{0.5bar}\right)^{5/6}t\left(1- \frac{5(p_b-p_a)^2}{216((p_m-0.5bar)/0.5bar)^2}\right)+O(\delta^4).\)

that can be calculated easily without treating the case \(p_a=p_b\) separately.

Once more, all this is very likely purely academic as it is not so easy to do dives that get into the regime where OTU matters at all. That is probably also why the empirical data is so poor.

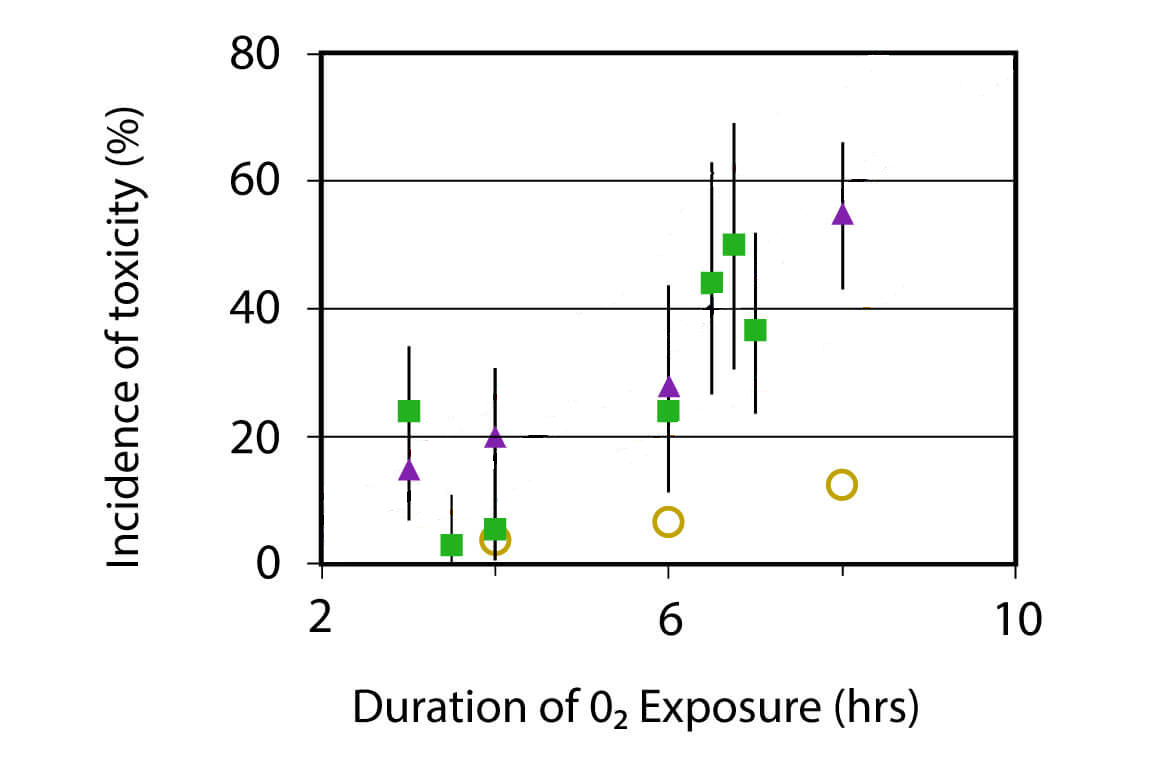
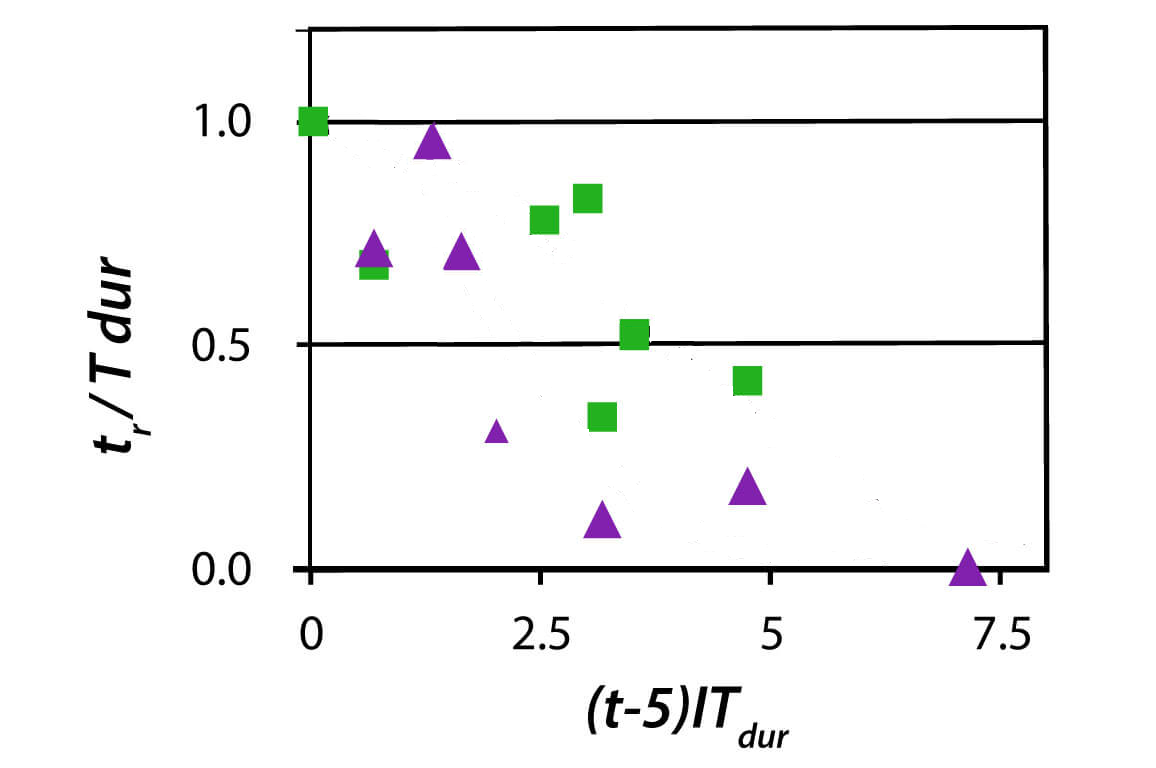
Even more recently, there was a report on new results in this area on rebreather.org. Their study produced data summarised in these plots:

Obviously, this data clearly suggests to fit it by some convoluted formula that yields a line that I manually erased from the graphs. Guess what it is and then check out the original link.