I often see complaints that two different dive planning programs or dive computers do not give identical deco schedules even though both claim to implement the same decompression model. Like both being Bühlmann with gradient factors. Once you implement a model, it should deterministically give you a plan for the ascend.
And yes, in an ideal world that would be true. But in ours, the model does not exist. Even though some description of how one is supposed to compute stops is written down, there are still a lot of undefined details that are up to the implementation to decide (often enough not consciously since the ill-definedness might be rather subtle). And I am not talking about random fudge factors that programmers add to their implementations to make the schedules more conservative and to reduce the DCS risk to divers following the program or computer’s advice (like always increasing the depth by a constant amount or some percentage or letting time run faster upon tissue loading and slower during off-gassing, OSTC I am looking at you!). IN particular, for dive computers with proprietary software the customer will never know which tweaks were implemented (or even advertised as features like taking temperature or heart rate into account or breathing rate or punishing ceiling violations). I am not saying these are bad ideas, it just makes schedules hard to compare
Here, I want to discuss more subtle issues, issues that arise since models are only defined in prose and that is up to interpretation. Like the original Bühlmann model being described in his book and gradient factors essentially defined in a figure on the last page of Erik Baker’s paper. In this respect, VPM-B is different: There exist texts but I find those confusing to say the least (which was also my motivation for some previous posts) and those are silent about things like repetitive diving or how to apply the model to real logged dives rather than in planning. The actual definition of VPM-B is, however, in the original FORTRAN program. And that has deterministic output. So that is clearly defined. On the other hand, the program does not tell you about the reasoning behind it so provides no basis for extrapolation (to things like logged dives).
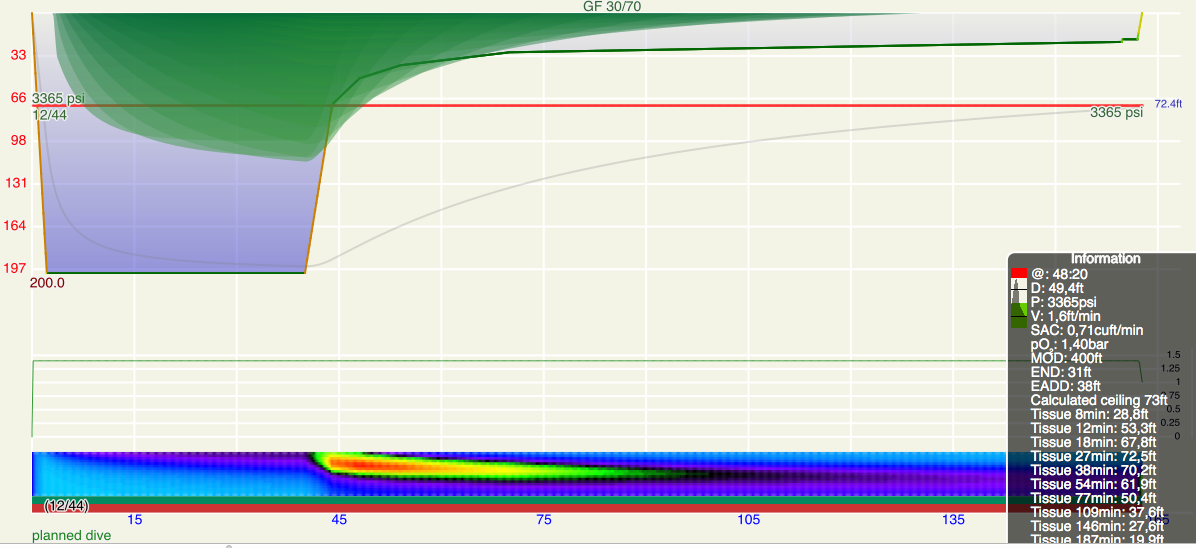
- When is it time to leave a stop? All models I know provide you with a current minimal ambient pressure given the tissue loadings and the current ambient pressure. So, should you leave your stop once that minimal ambient pressure is less or equal than the ambient pressure of your next potential stop? This might be the naive guess. But one could also take into account not the current ambient pressure but that of the stop. And for gradient factors (see below), one has to take the gradient factor into account not at the current depth but at the depth of the next stop (or ceiling). I have seen implementations that got the maths of this wrong. But there is another thing that one could take into account: There is further off-gassing during the ascend to the next stop. So, the criterium should not be if the next stop is below the ceiling once i leave the previous stop but once I reach the next. To me, this is the only sensible criterium, so Subsurface does this for Bühlmann where it is not specified. But in order to be 100% compatible with the original implementation of VPM-B, using that model, we take the criterium to be the ceiling at the time of leaving the previous stop. The difference is minimal but can make stops one minute shorter or longer (and due to on-gassing on the deeper stops also influence the length of the shallower stops).
- The next difference is in what actually constitutes stop times: Everybody wants there stops to have integer minute lengths. But what exactly is the length of a stop (which is then subject to integer rounding), starting at the time you leave the previous stop or only at the time you arrive at the next? For 9m/min ascent rate and 3m intervals, this difference is 20s. This is only a rounding effect, so the immediate difference is only one minute per stop. But again, due to on-gassing of slow tissues on deeper stops this difference can multiply at the shallower stops.
- Looking at the graphics that is supposed to define gradient factors, Gradient factor definition one understands that the GFlow is supposed to be applied at the first stop depth. So far, so good. But what is that exactly? Is the the ceiling at the end of the bottom time? Or the deepest ceiling ever encountered during the dive? Or should we take into account the off-gassing during the ascend and take it to be the first time we actually hit the ceiling (since the first ceiling we see at the end of the bottom time might have moved up during the ascent? The last option is probably what was implied by Baker. And that might well apply to a planned dive. But not so much for a real dive: Image a carful diver that always does his stops one meter too deep (at the price of potentially longer stops). He never reaches the “first stop” in a strict sense because he always stays shy of reaching that stop and waits for it to clear before the further ascent (one could summarize his behavior also in terms of a very very slow ascent rate). So, in a strict sense, for this diver, GFlow never applies (or only at the surface). Of course, this does not really make sense and thus, to avoid this paradox, in Subsurface we use the deepest ceiling encountered during the dive as the anchor depth for GFlow (also since for logged dives there is no clear distinction between the bottom part of the dive and the ascent).
- Finally, there are some other smaller ill-defined bits, like in how to average things when diving with different gases (as initially N2 and He are treated separately), how to take care of the notorious water vapor (and which partial pressure assume for it).
So in summery, even if two implementations follow the letters of the definition of a decompression model, they might come up with different deco plans. For all practical purposes, those differences should be small (like a few percent of total decompression time) and thus be hidden in the much larger systematic error of all these very simple models (after all, we do not have good information about all the things that are going on in a diver’s body) but they can be big enough to make people worry since they think decompression is an exact science or even that computer programs should be deterministic. Yes, programs can be deterministic, but it is well possible that a model described only in prose has several different implementations.
PS: Something completely different: I set up a Facebook page for this blog. Subscribe it if you want to be notified whenever a new post appears!
