In a comment, Rick suggested that given that in the end, VPM-B computes depth dependent maximal gradients, one could compare those to the depth dependent gradients computed from the Buehlmann model and expressed as gradient factors (i.e. as percentage of the gradient of a plain vanilla Buehlmann gradient). Here is what I found when I did this.
For concreteness, I computed deco schedules with Subsurface for a dive to 120m leaving the bottom at runtime 20min with TMX18/50 (yes, I know this is far too much pO2, but for deco that does not matter), EAN50 and EAN100. For some reason, my ascent speeds are set to 9m/min up to 75% average depth, then 6m/min up to 6m and 1m/min for the final ascent. With Bühlmann with GF 30/80, I obtain a plan that reaches the surface at a runtime of 188min while for VPM-B+1 it takes only 141min.
Actually, I patched subsurface a little bit (see this branch on github) that, during deco, it prints out the allowed gradient for all tissues at all deco stops. This output I ran thru a mathematica notebook to produce these plots:
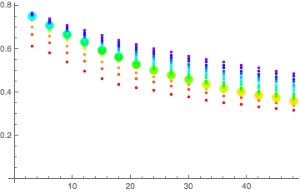
On the x-axis, we have depth in meters while on the y-axis, we have the current gradient factor. The different colored dots are the different tissues (red being those with the shortest halft-time) with the thick dot indicating the leading tissue, i.e. the tissue that is causing the current stop.
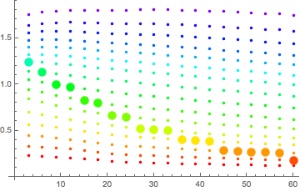
The first diagram is Bühlmann while the second is VPM-B.
A few remarks are in order: First, why is Bühlmann not a single line from GF 30 to GF 40? This is because of the way I compute things: The exact Bühlmann a and b coefficients depend on the gas mixture currently in the tissue. In addition, what is actually computed is the maximal ambient pressure at the ceiling (which is the current depth only for the leading tissue) for that tissue and the gradient I plot is the difference between that and the current ambient pressure. So this is not exactly the right thing for tissues that are not leading. But still we see, it is a nice band of values and they all nicely move between 30% and 80%.
For the VPM-B plot, on the other hand, we see that the variation within a tissue is much less but the gradient factor varies a lot more between tissues. After all, the actual variation in gradient factor with depth comes about mainly because the leading tissue is changing and much less from the cubic curve that implements the Boyle compensation.
The other thing that is striking is the scale: At the last deco stop, the effective gradient factor is 124% for the leading tissue (while for some slower ones it is as high 180% (which never matters as that tissue never leads). In fact, a Bühlmann plan with GF 20/125 leads to a very similar profile.
Here are the actual profiles: First, Bühlmann GF 30/80
Depth
Duration
Runtime
Gas
➘ 120m 7min 7min (18/50) ➙ 120m 13min 20min ➚ 51m 9min 29min – 51m 2min 31min ➚ 48m 1min 32min – 48m 1min 32min ➚ 45m 1min 33min – 45m 2min 34min ➚ 42m 1min 35min – 42m 2min 36min ➚ 39m 1min 37min – 39m 4min 40min ➚ 36m 1min 41min – 36m 3min 43min ➚ 33m 1min 44min – 33m 4min 47min ➚ 30m 1min 48min – 30m 6min 53min ➚ 27m 1min 54min – 27m 6min 59min ➚ 24m 1min 60min – 24m 10min 69min ➚ 21m 1min 70min – 21m 5min 74min EAN50 ➚ 18m 1min 75min – 18m 7min 81min ➚ 15m 1min 82min – 15m 8min 89min ➚ 12m 1min 90min – 12m 13min 102min ➚ 9m 1min 103min – 9m 20min 122min ➚ 6m 1min 123min – 6m 20min 142min EAN100 ➚ 3m 3min 145min – 3m 40min 185min ➚ 0m 3min 188min
Then VPM-B+1:
|
Depth |
Duration |
Runtime |
Gas |
|
| ➘ | 120m | 7min | 7min | (18/50) |
| ➙ | 120m | 13min | 20min | |
| ➚ | 63m | 7min | 27min | |
| – | 63m | 1min | 28min | |
| ➚ | 57m | 1min | 29min | |
| – | 57m | 1min | 30min | |
| ➚ | 54m | 1min | 31min | |
| – | 54m | 1min | 31min | |
| ➚ | 51m | 1min | 32min | |
| – | 51m | 2min | 33min | |
| ➚ | 48m | 1min | 34min | |
| – | 48m | 1min | 34min | |
| ➚ | 45m | 1min | 35min | |
| – | 45m | 2min | 36min | |
| ➚ | 42m | 1min | 37min | |
| – | 42m | 2min | 38min | |
| ➚ | 39m | 1min | 39min | |
| – | 39m | 3min | 41min | |
| ➚ | 36m | 1min | 42min | |
| – | 36m | 3min | 44min | |
| ➚ | 33m | 1min | 45min | |
| – | 33m | 3min | 47min | |
| ➚ | 30m | 1min | 48min | |
| – | 30m | 4min | 51min | |
| ➚ | 27m | 1min | 52min | |
| – | 27m | 5min | 56min | |
| ➚ | 24m | 1min | 57min | |
| – | 24m | 7min | 63min | |
| ➚ | 21m | 1min | 64min | |
| – | 21m | 4min | 67min | EAN50 |
| ➚ | 18m | 1min | 68min | |
| – | 18m | 5min | 72min | |
| ➚ | 15m | 1min | 73min | |
| – | 15m | 6min | 78min | |
| ➚ | 12m | 1min | 79min | |
| – | 12m | 8min | 86min | |
| ➚ | 9m | 1min | 87min | |
| – | 9m | 12min | 98min | |
| ➚ | 6m | 1min | 99min | |
| – | 6m | 15min | 113min | EAN100 |
| ➚ | 3m | 3min | 116min | |
| – | 3m | 22min | 138min | |
| ➚ | 0m | 3min | 141min |
Finally Bühlmann 20/125:
|
Depth |
Duration |
Runtime |
Gas |
|
| ➘ | 120m | 7min | 7min | (18/50) |
| ➙ | 120m | 13min | 20min | |
| ➚ | 54m | 8min | 28min | |
| – | 54m | 1min | 29min | |
| ➚ | 51m | 1min | 30min | |
| – | 51m | 2min | 31min | |
| ➚ | 48m | 1min | 32min | |
| – | 48m | 1min | 32min | |
| ➚ | 45m | 1min | 33min | |
| – | 45m | 2min | 34min | |
| ➚ | 42m | 1min | 35min | |
| – | 42m | 2min | 36min | |
| ➚ | 39m | 1min | 37min | |
| – | 39m | 2min | 38min | |
| ➚ | 36m | 1min | 39min | |
| – | 36m | 3min | 41min | |
| ➚ | 33m | 1min | 42min | |
| – | 33m | 3min | 44min | |
| ➚ | 30m | 1min | 45min | |
| – | 30m | 5min | 49min | |
| ➚ | 27m | 1min | 50min | |
| – | 27m | 5min | 54min | |
| ➚ | 24m | 1min | 55min | |
| – | 24m | 6min | 60min | |
| ➚ | 21m | 1min | 61min | |
| – | 21m | 4min | 64min | EAN50 |
| ➚ | 18m | 1min | 65min | |
| – | 18m | 4min | 68min | |
| ➚ | 15m | 1min | 69min | |
| – | 15m | 7min | 75min | |
| ➚ | 12m | 1min | 76min | |
| – | 12m | 8min | 83min | |
| ➚ | 9m | 1min | 84min | |
| – | 9m | 13min | 96min | |
| ➚ | 6m | 1min | 97min | |
| – | 6m | 12min | 108min | EAN100 |
| ➚ | 3m | 3min | 111min | |
| – | 3m | 21min | 132min | |
| ➚ | 0m | 3min | 135min |